


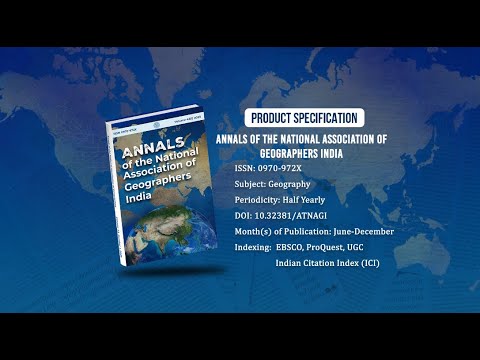
Annals of the National Association of Geographers India - A UGC-CARE Listed Journal
Published in Association with National Association of Geographers, India (NAGI)
Current Volume: 45 (2025 )
ISSN: 0970-972X
Periodicity: Half-Yearly
Month(s) of Publication: June & December
DOI: https://doi.org/10.32381/ATNAGI
Online Access is Free for All Life Member of NAGI
Pattern and Dynamics of Land Use/Land Cover in Patna Metropolitan City, India
By : Anjani Kumar , Ram Sakal Yadava
Page No: 392-413
Abstract
Urbanisation is the most prominent process of human settlements in towns/cities that got accelerated after the European industrial revolution. Traditionally, human settlements have been developed along water bodies especially bank of rivers. Many of these riverfront settlements evolved into metropolises. Urban landscape in riverfront metropolises is ecologically sensitive. Urban land use, especially built-up land, is a crucial indicator to study the level of urbanisation in the city. With a mere 11.29% of the urban population to the total population, Bihar falls at the bottom of the urbanised state in India (Census, 2011). Being the capital as well as the largest city of Bihar, Patna is facing an unprecedented burden of urban agglomeration with inadequate civil amenities and facilities. This study attempts to analyse the land use/land cover pattern and its dynamics during the last three decades, i.e., 1991 to 2021. The study of the LU/LC dynamics is helpful to analyse the rate of urban expansion. The spatio-temporal analysis and assessment of the urban land use/land cover change in Patna metropolitan city has been carried using spaceborne Remote Sensing data, i.e., Landsat Imagery (TM/OLI), for the years 1991, 2001, 2011 and 2021 processed with photogrammetry tools, Geographical Information System (GIS), and accuracy assessment. Erdas Imagine 2015 and ArcGIS 10.8.2 have been used for Satellite Image interpretation and preparing the final LU/LC maps, respectively. The processing of accuracy assessment uses Ground Control Points (GCPs) collected through GPS and Google earth historical imagery to verify randomly generated points from LU/ LC images. Ms-excel has been used to generate spatial statistics of the area. The study reveals that green space and water bodies have continuously decreased while built-up land has gradually increased. Urban built-up area has increased from 25.68 (1991), 37.16 (2001), 73.58 (2011), to 87.24 (2021) per cent of the geographical area of the city.
Authors :
Anjani Kumar : Ph.D., Department of Geography, Institute of Science, Banaras Hindu University, Varanasi, Uttar Pradesh, India.
Ram Sakal Yadava : Professor (Retd.), Department of Geography, Institute of Science, Banaras Hindu University, Varanasi, Uttar Pradesh, India.
DOI: https://doi.org/10.32381/ATNAGI.2024.44.02.10